
Jeremy was born and raised in the heart of the Midwest. He grew up playing football and throwing discus, doing improvisational and stand-up comedy, and performing in theater productions, several musical groups, and touring choirs. He was recently honored as the 2024 Pleasant Valley High School Distinguished Alumni Awardee. These days, he be found biking around Richmond, Virginia’s James River Park System, Pocahontas State Park, and leading the Greater Scott’s Addition Association Board of Directors.
Jeremy graduated summa cum laude and with Distinction in Geology from Augustana College in Rock Island, Illinois, then earned his Ph.D. in Geology with a focus in Paleoclimatology at Oregon State University as a National Science Foundation Graduate Research Fellow and OMSI Science Communication Fellow. Jeremy then served as the David and Jane Cohn Scientist at the Science Museum of Virginia from 2016-2023 before being named as the Director of Impact Evaluation and Community Science at Groundwork USA in June 2023.
Jeremy is an award-winning scientist and communicator who regularly engages with audiences of all ages and backgrounds to explore climate change and how it works on multiple timescales from human (days to decades) to geologic (millions of years). He was a co-principal investigator and co-author on a study that established what would become the NOAA Climate Program Office/NIHHIS Urban Heat Island Mapping Campaigns, and you can find the data for these campaigns here: https://osf.io/f9nhg/.
See Jeremy's research and public speaking experience below.
RESEARCH & PUBLICATION HIGHLIGHTS - VISIT MY ORCID
Fifth national climate assessment chapter 22. southeast (Link)
Hoffman, J.S., S.G. McNulty, C. Brown, K.D. Dello, P.N. Knox, A. Lascurain, C. Mickalonis, G.T. Mitchum, L. Rivers III, M. Schaefer, G.P. Smith, J.S. Camp, and K.M. Wood, 2023: Ch. 22. Southeast. In: Fifth National Climate Assessment. Crimmins, A.R., C.W. Avery, D.R. Easterling, K.E. Kunkel, B.C. Stewart, and T.K. Maycock, Eds. U.S. Global Change Research Program, Washington, DC, USA. https://doi.org/10.7930/NCA5.2023.CH22

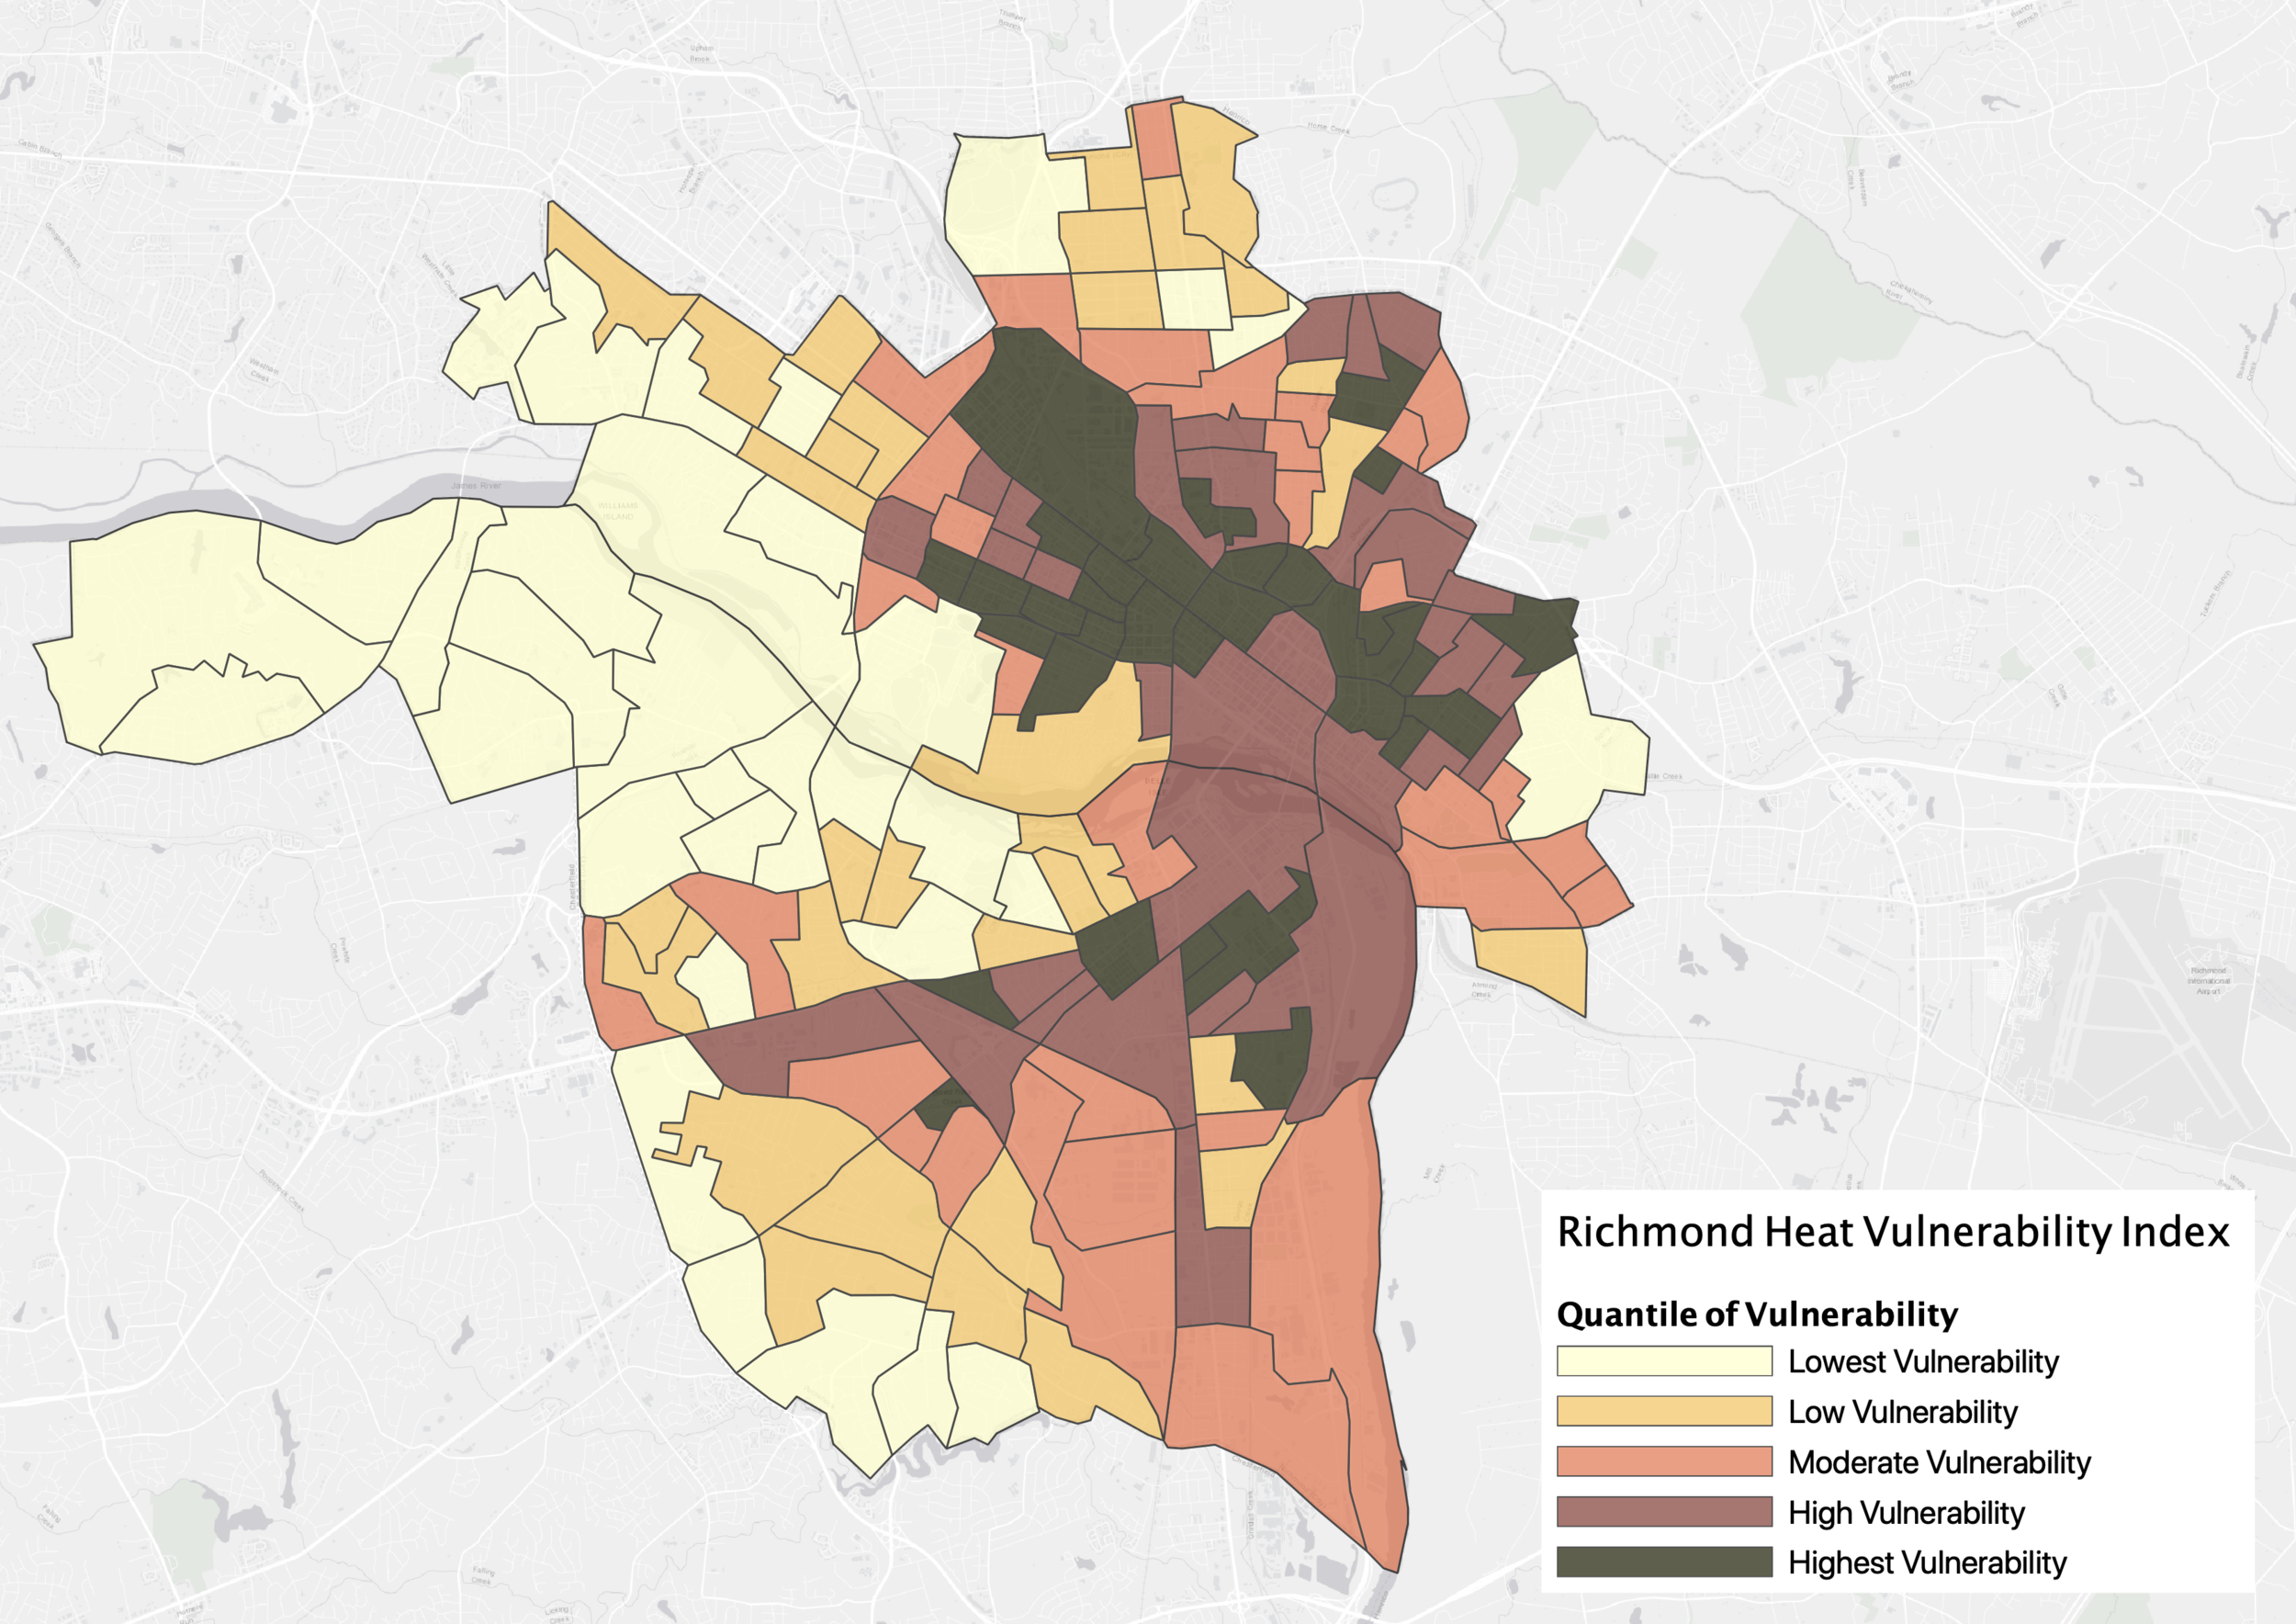
Historical housing policy linked with present-day exposure to urban heat (LINK)
Hoffman, J.S.; Shandas, V.; Pendleton, N. The Effects of Historical Housing Policies on Resident Exposure to Intra-Urban Heat: A Study of 108 US Urban Areas. Climate 2020, 8, 12, https://doi.org/10.3390/cli8010012.
Below, find an interactive map presenting the results from this paper. Find this interactive map at bit.ly/redhotcities.
See coverage of this paper in NPR, The Guardian, CityLab, and Scientific American.
I wrote a blog about this work on the Science Museum of Virginia’s website.
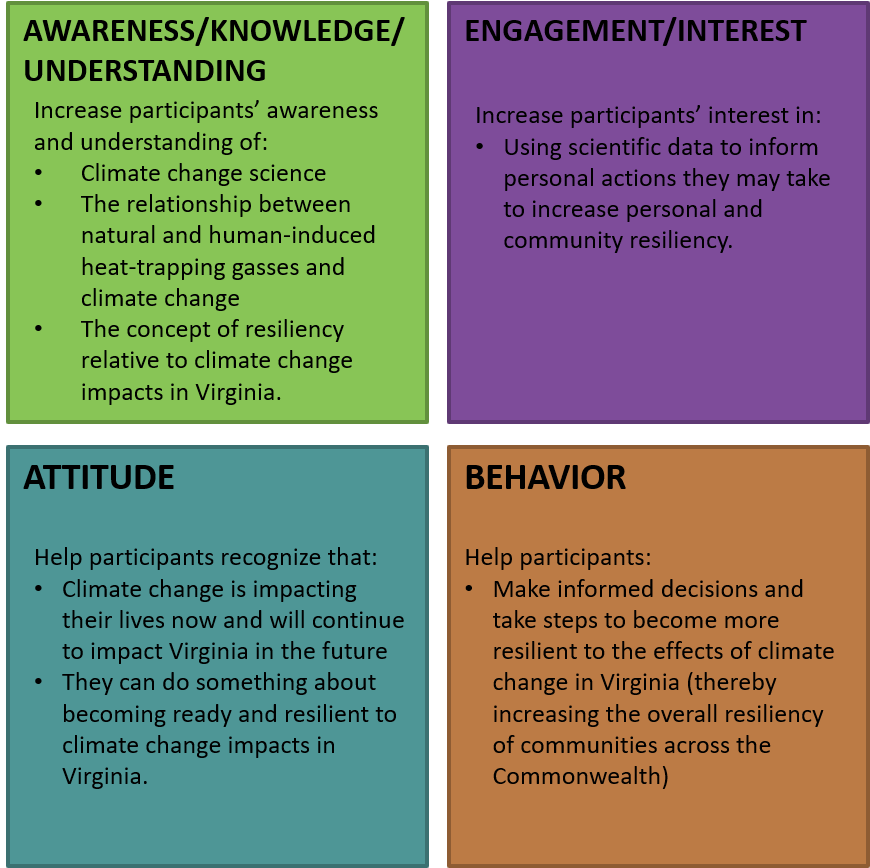
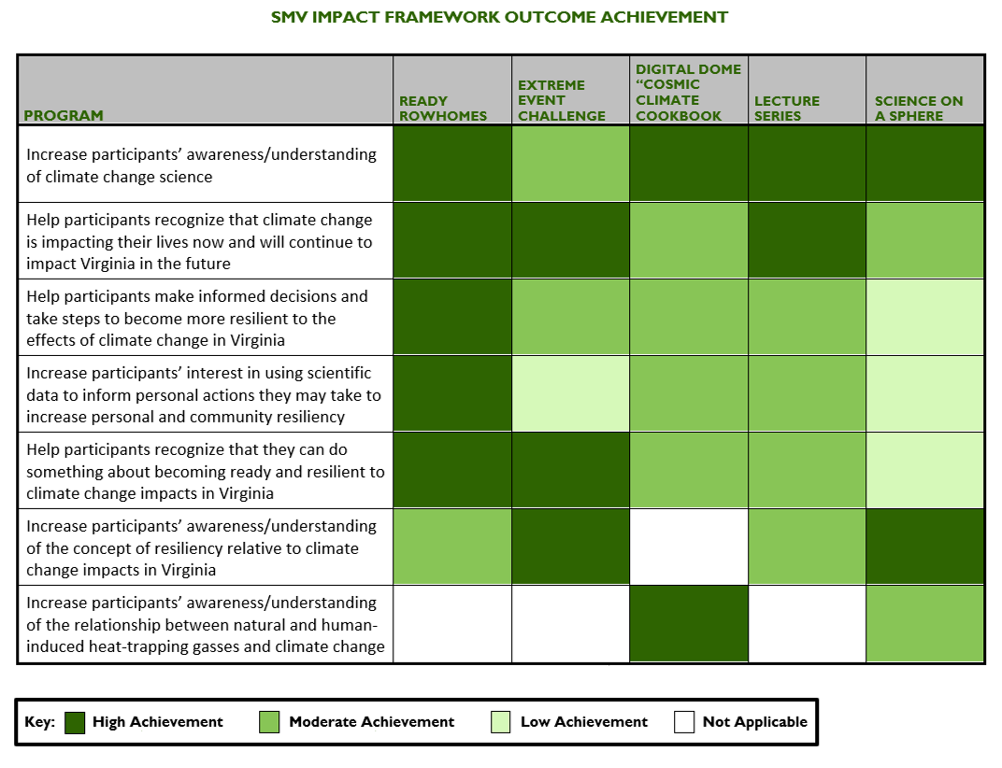
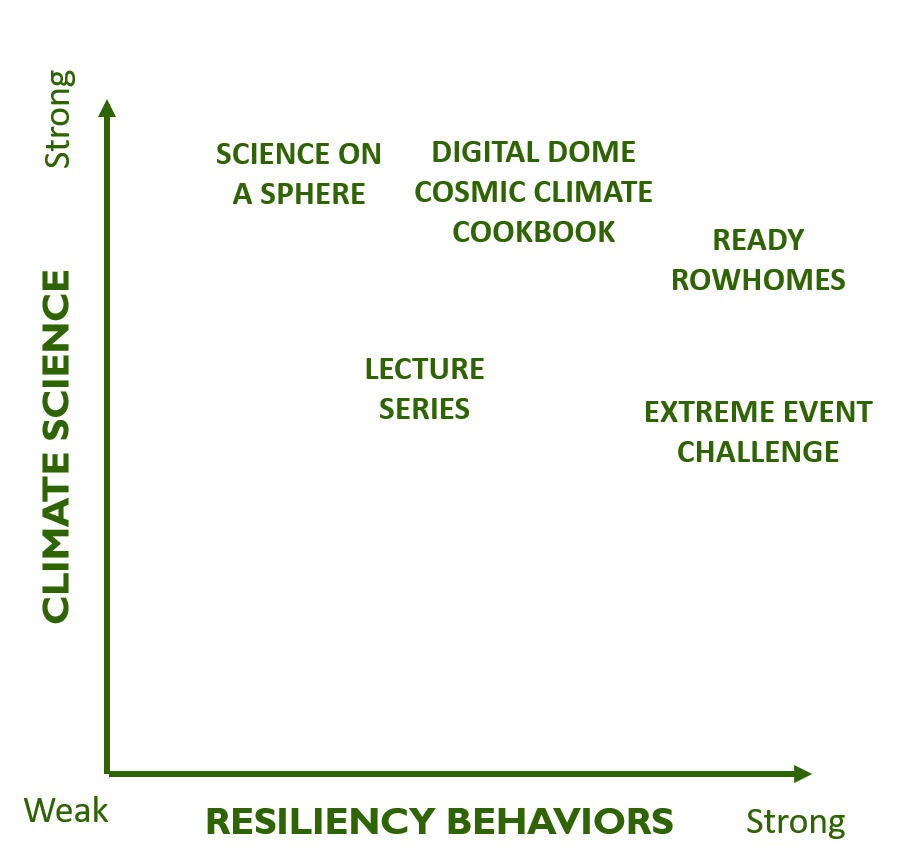
INCREASING CLIMATE RESILIENCE LITERACY IN RICHMOND, VA (LINK TO PDF)
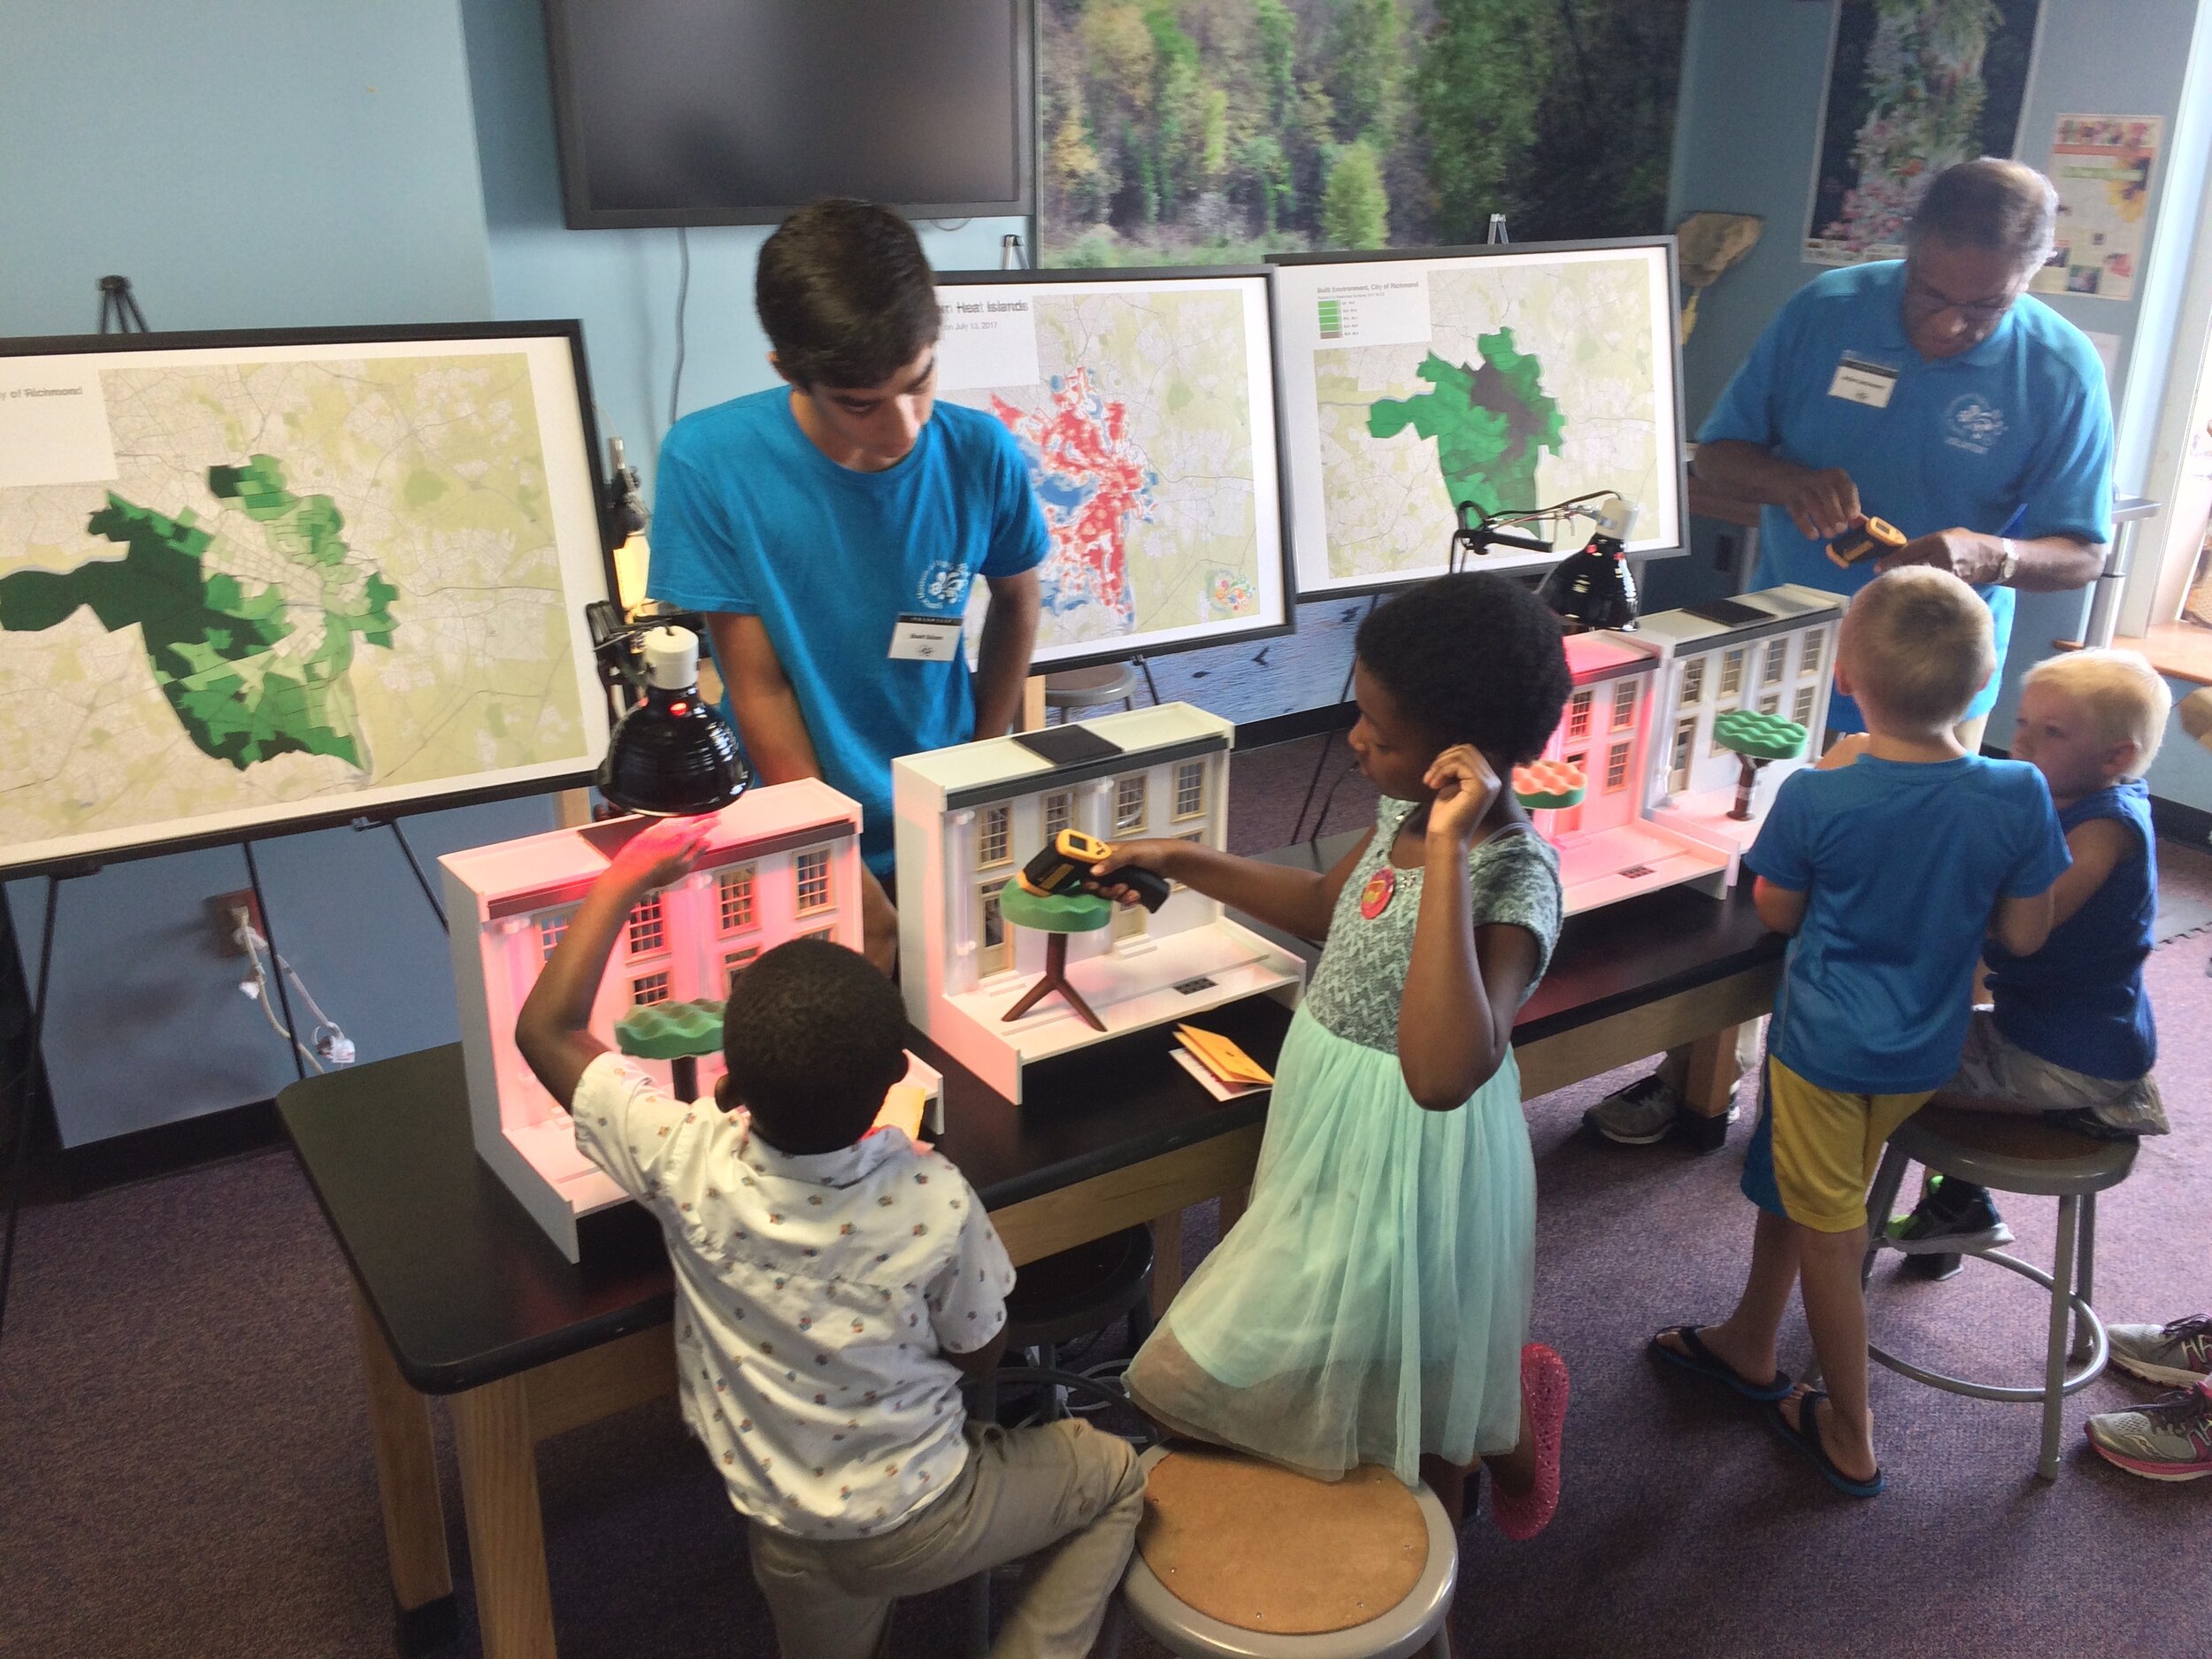
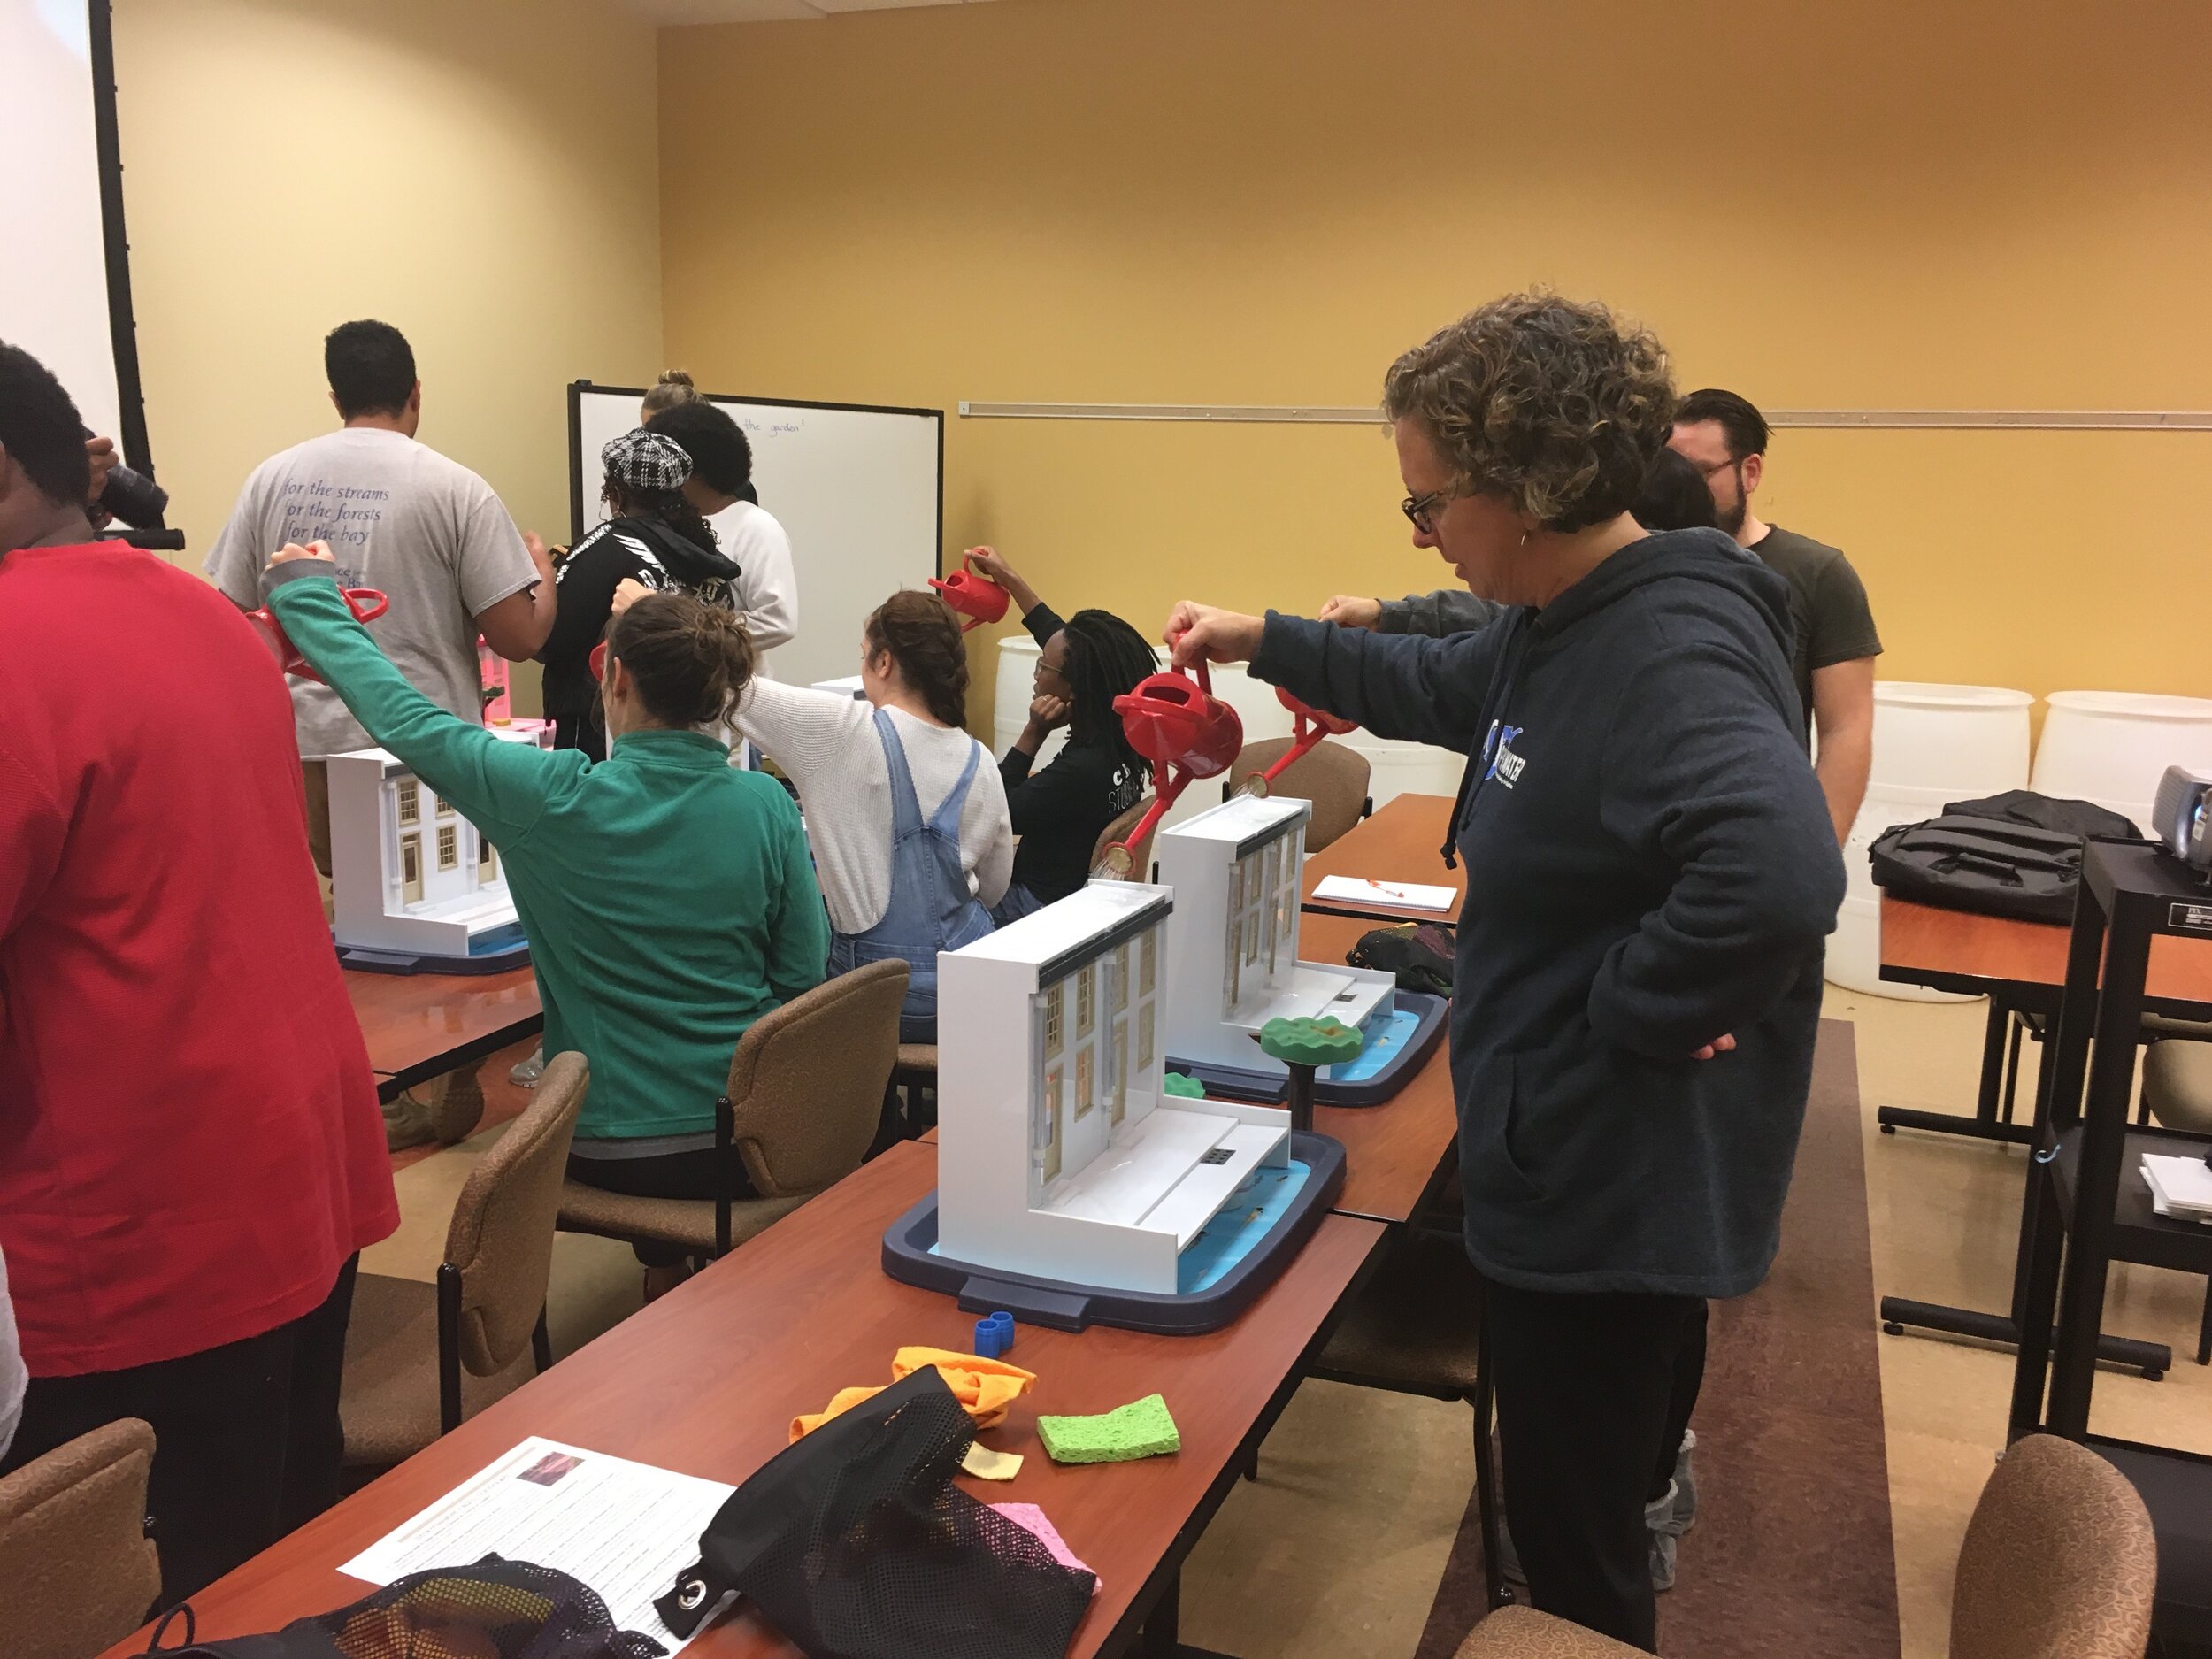
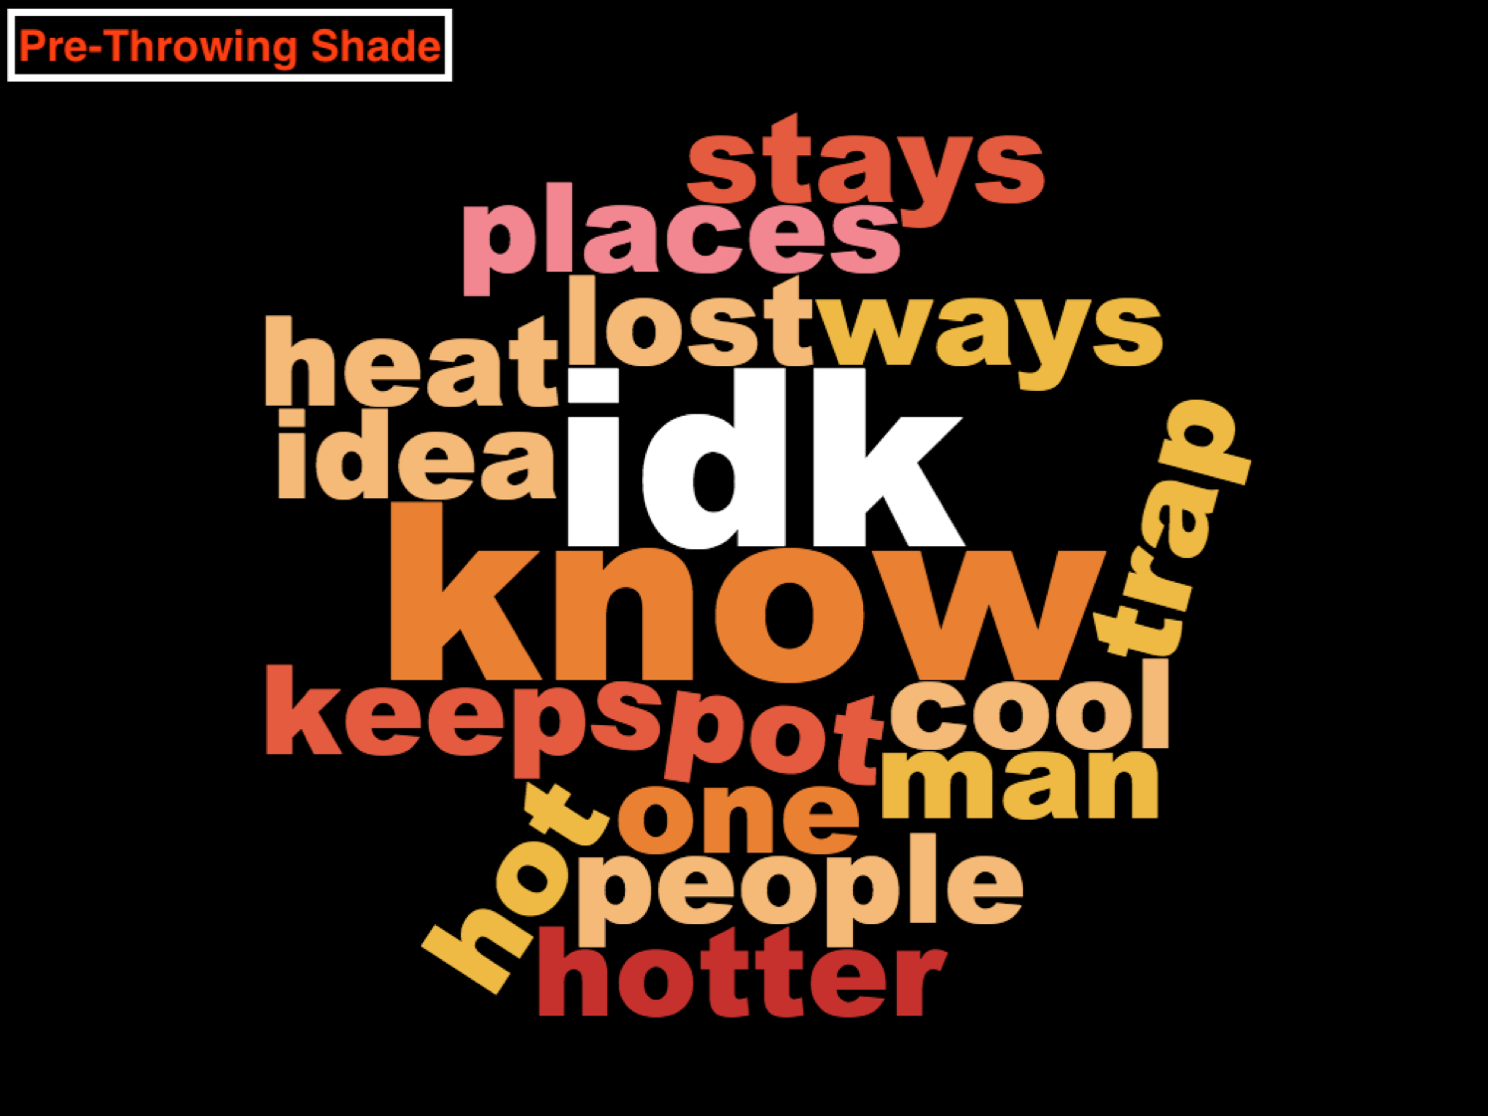
Hoffman, J.S., Learn, Prepare, Act: “Throwing Shade” on Climate Change, Journal of Museum Education 2020, 45(1), 28-41, doi: 10.1080/10598650.2020.1711496
Why this paper matters: The Science Museum of Virginia developed, delivered, and evaluated climate science and resiliency-themed programming over a three year period (2015-2018), connecting with audiences from “K to grey.” Hyper-localization of climate change, accomplished by leading a small-scale community-based participatory research campaign (also known as “citizen science”) to assess the City of Richmond’s urban heat island effect, improved audience literacy and recall of adaptation and resilience solutions.

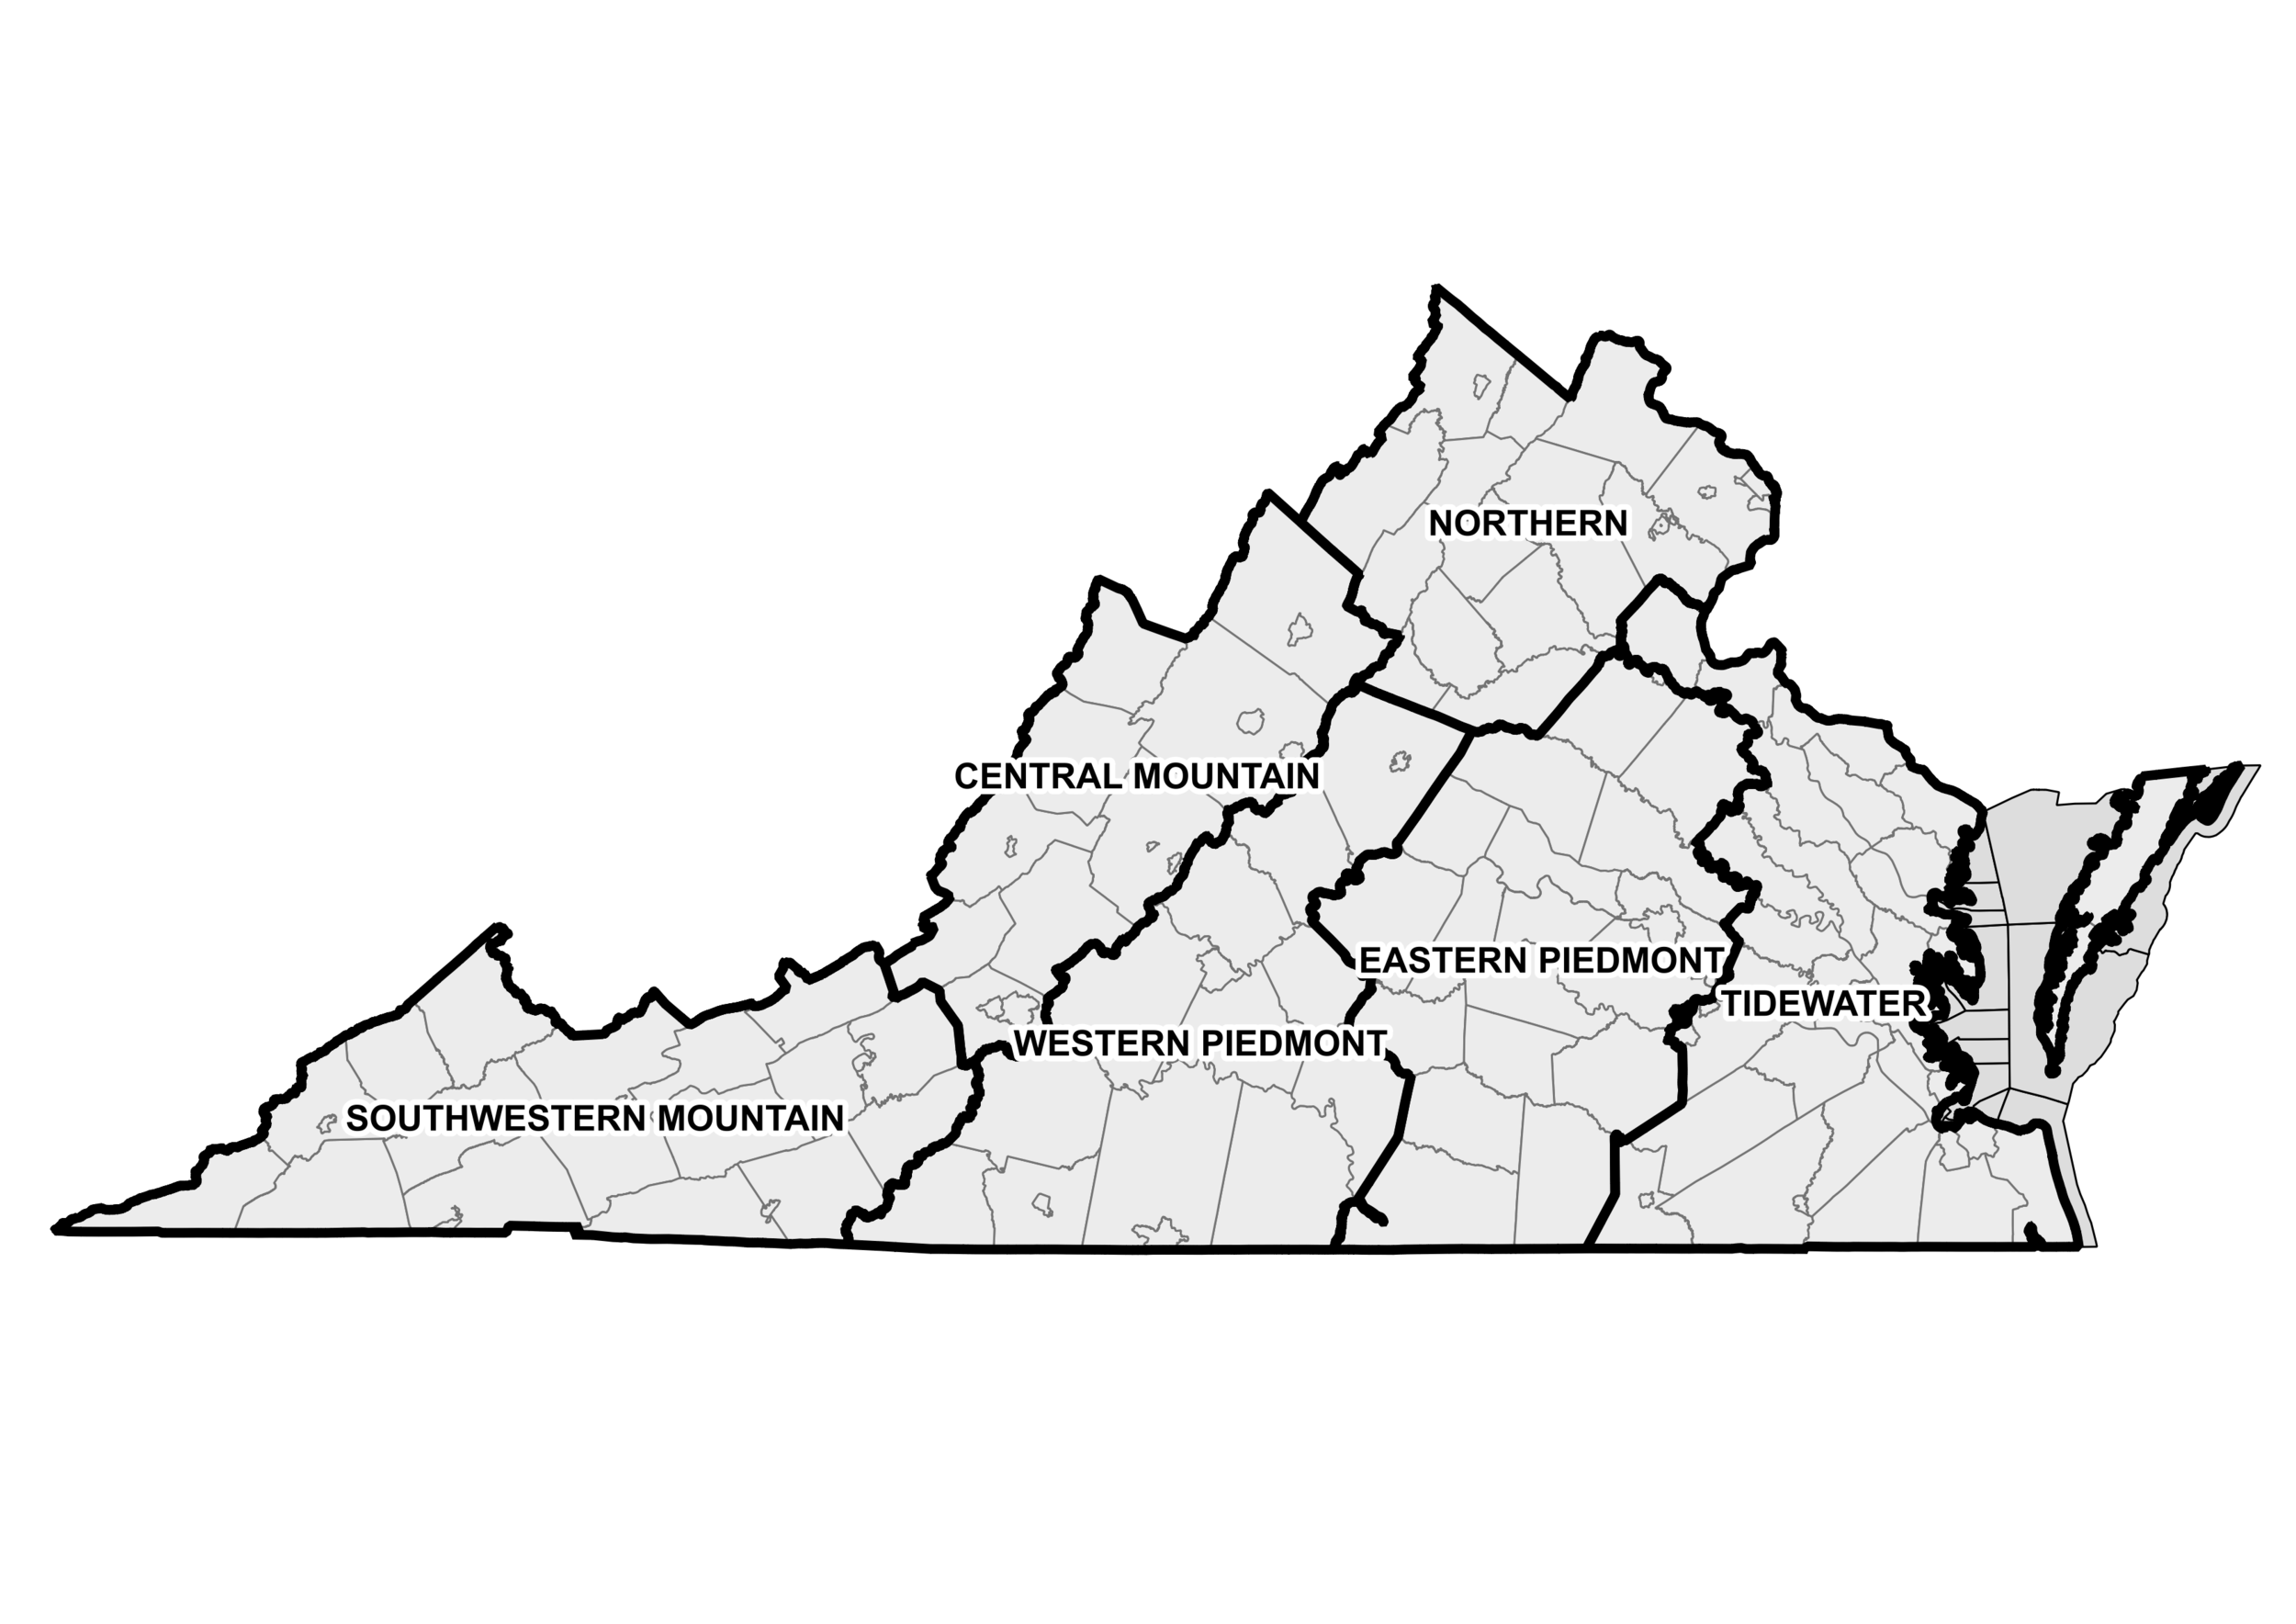
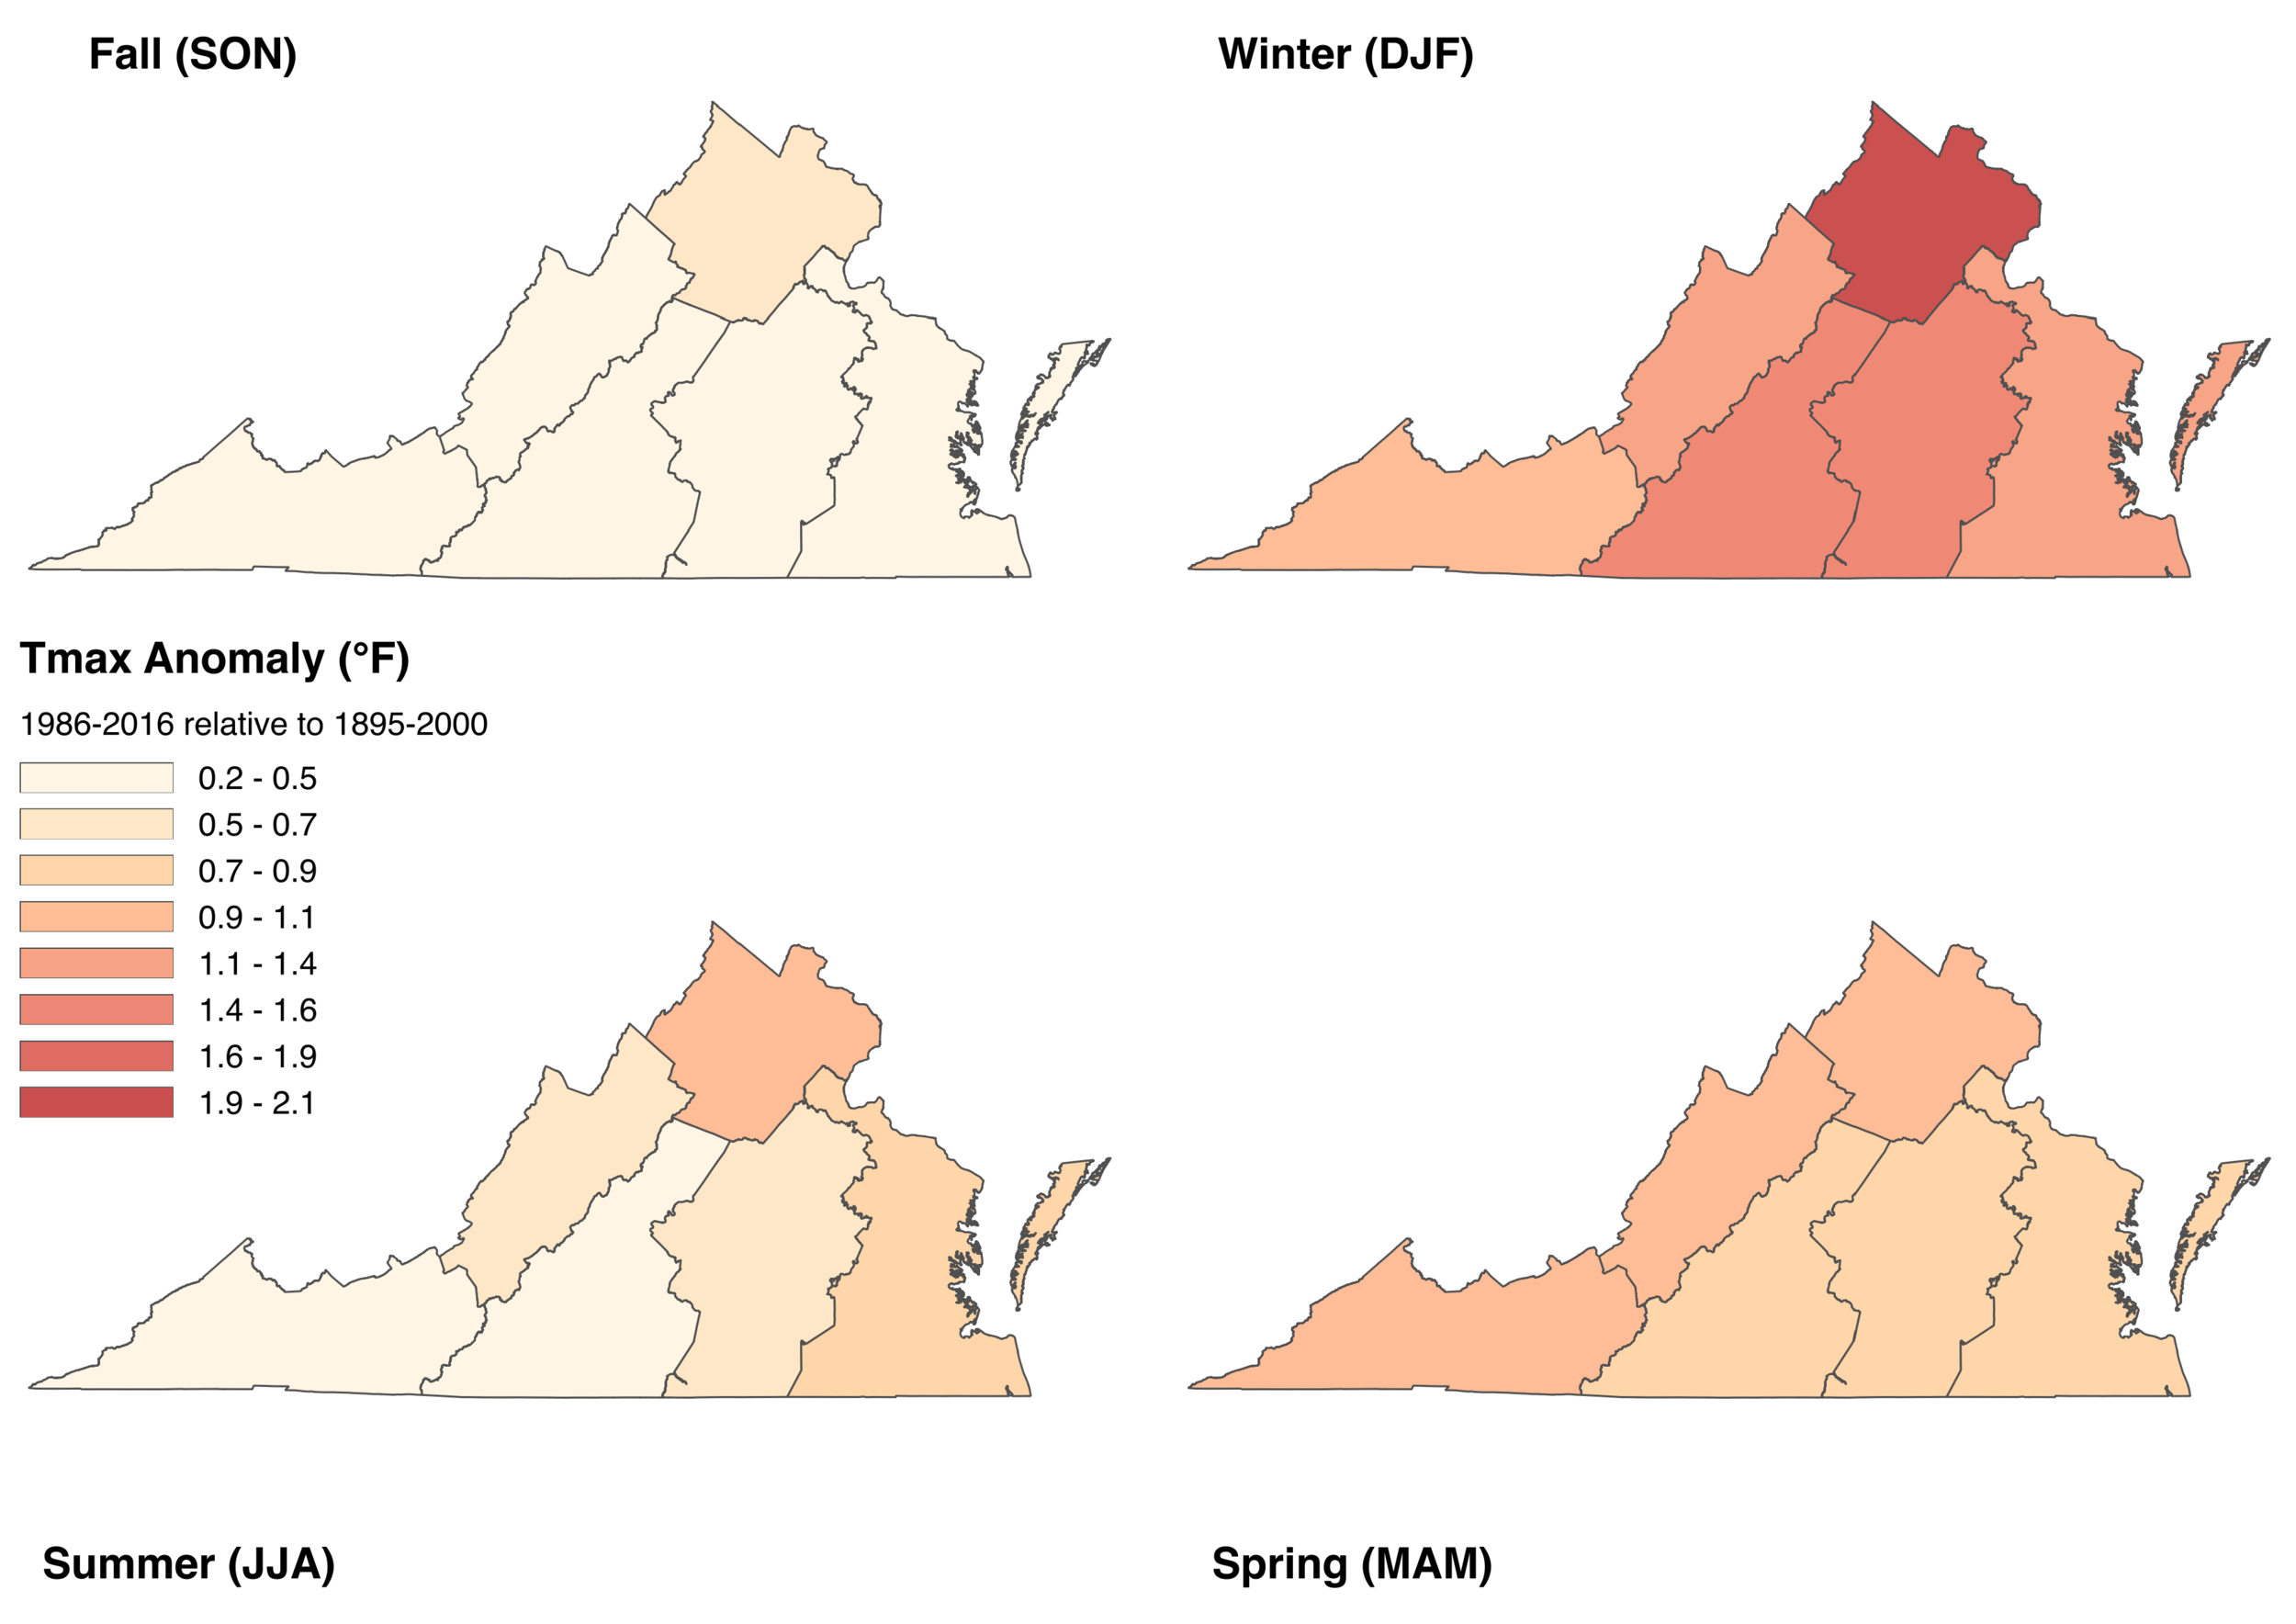
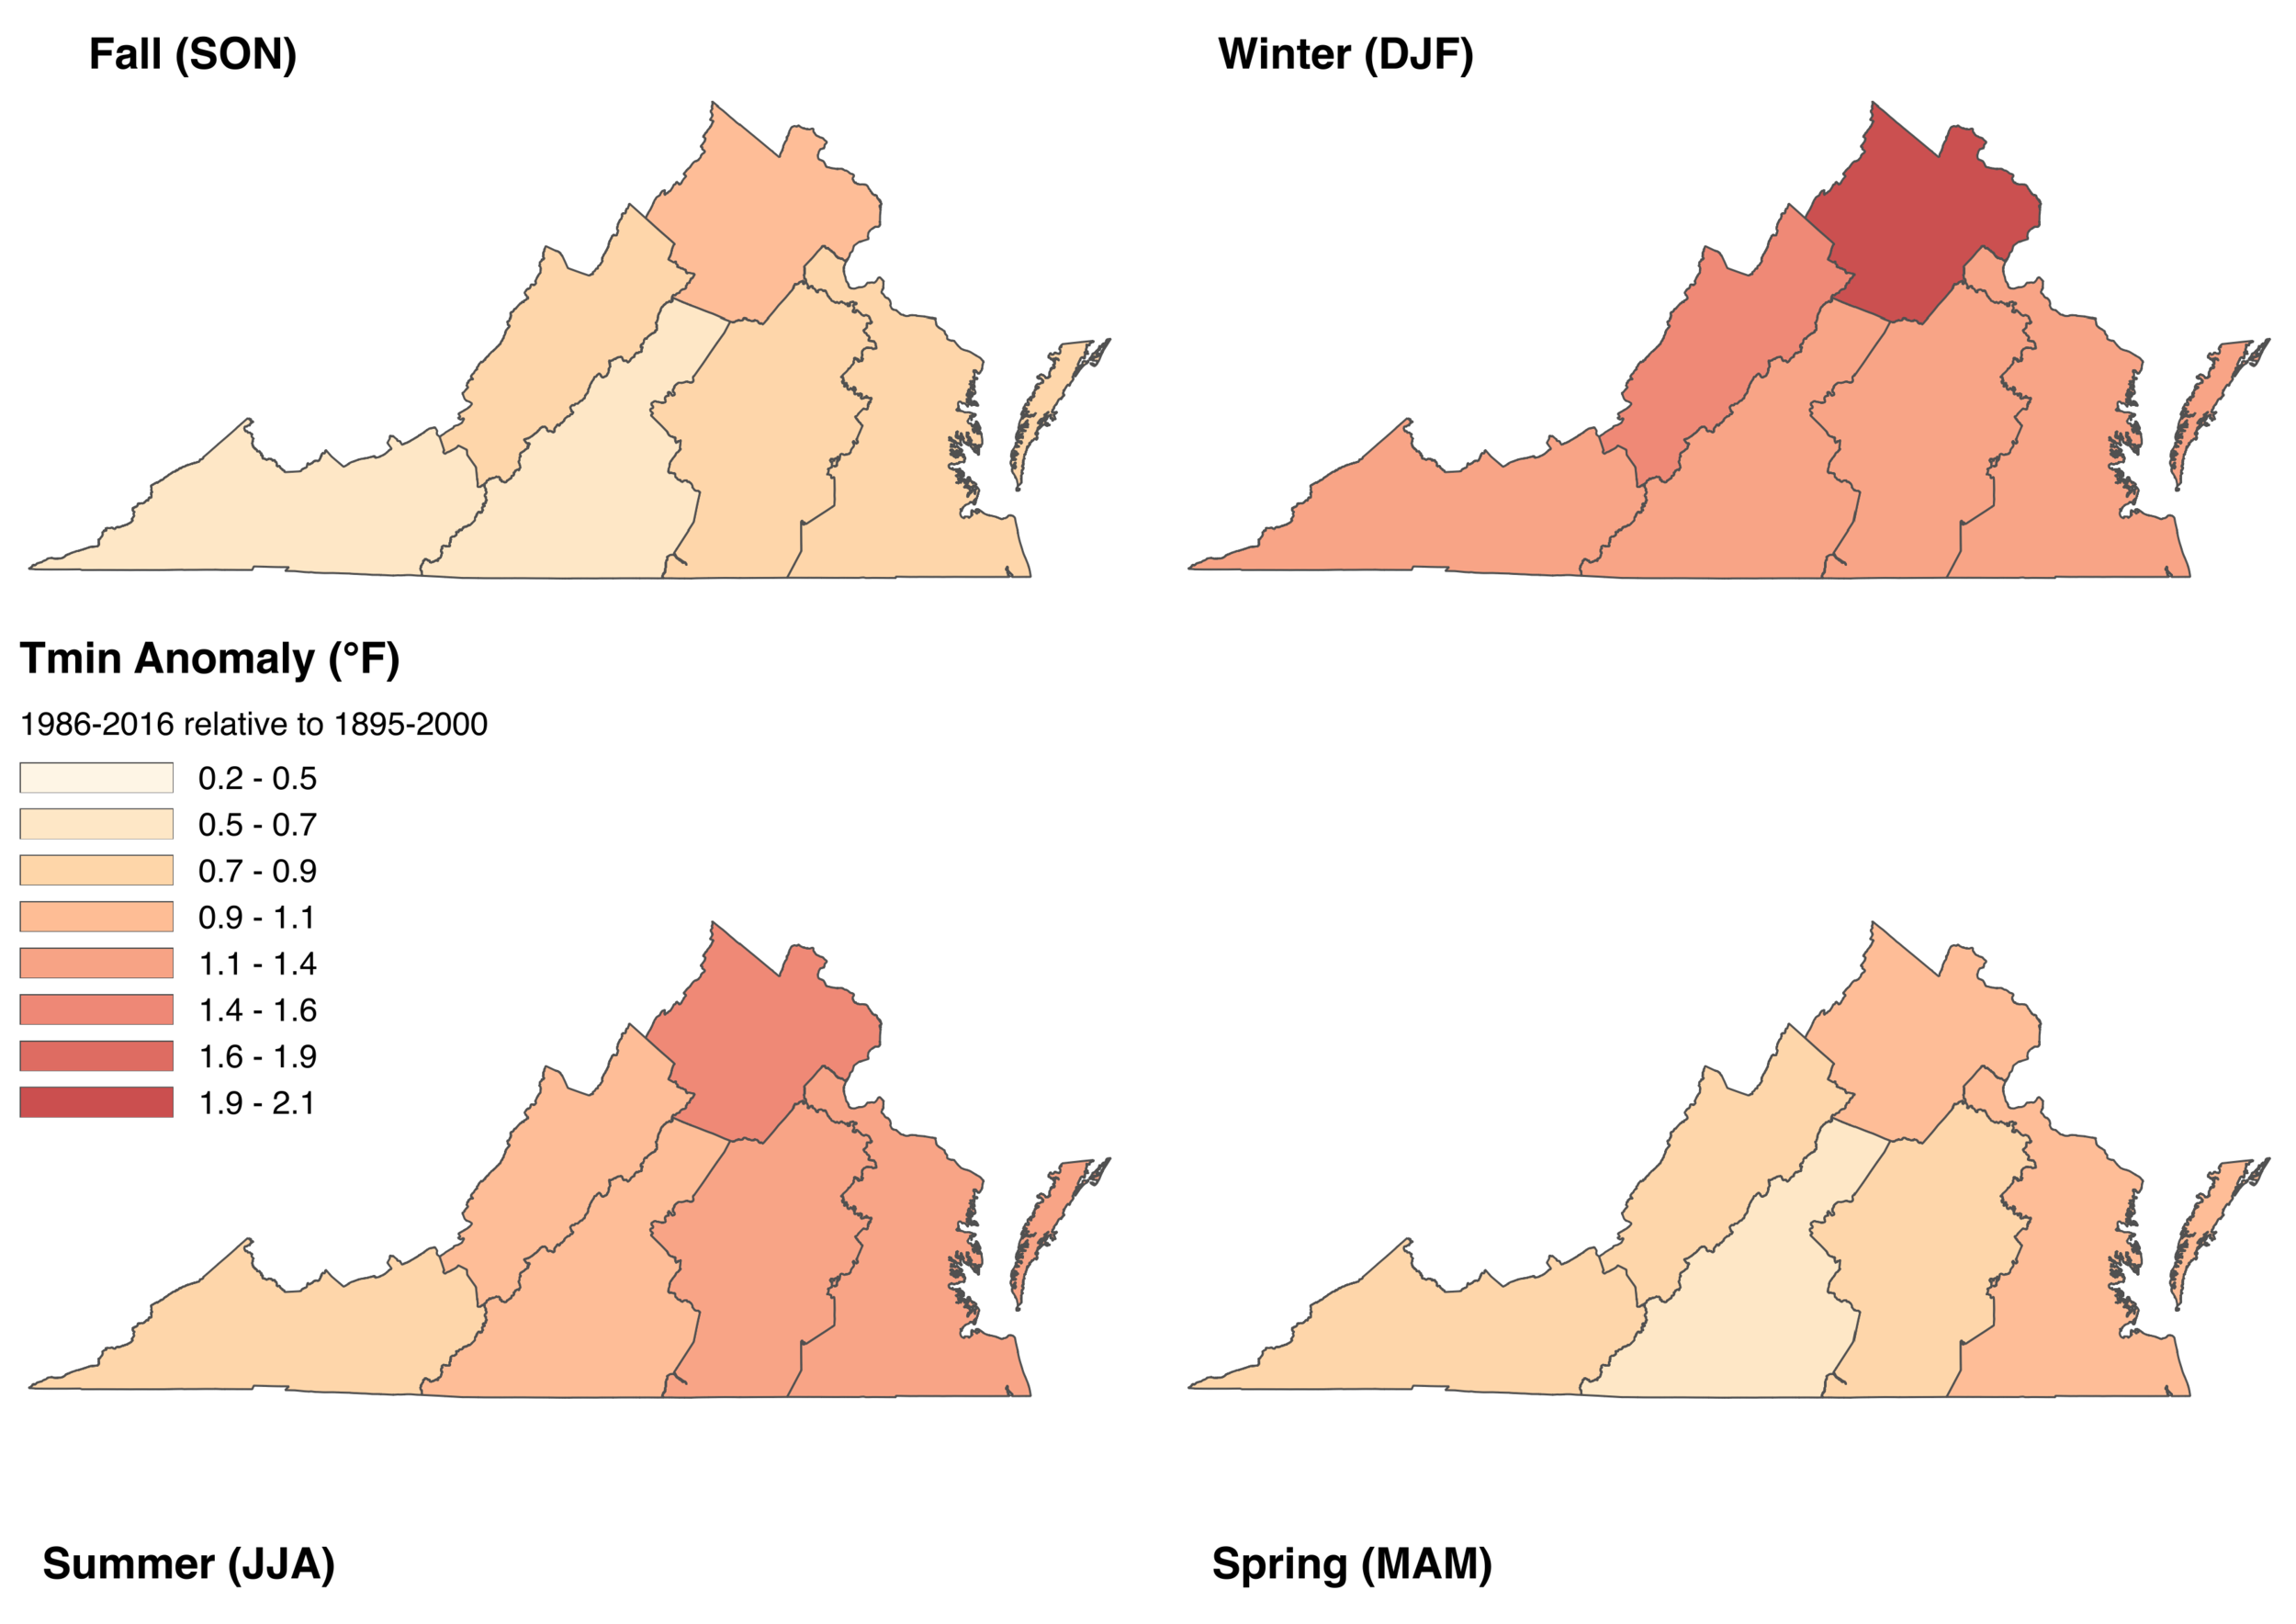
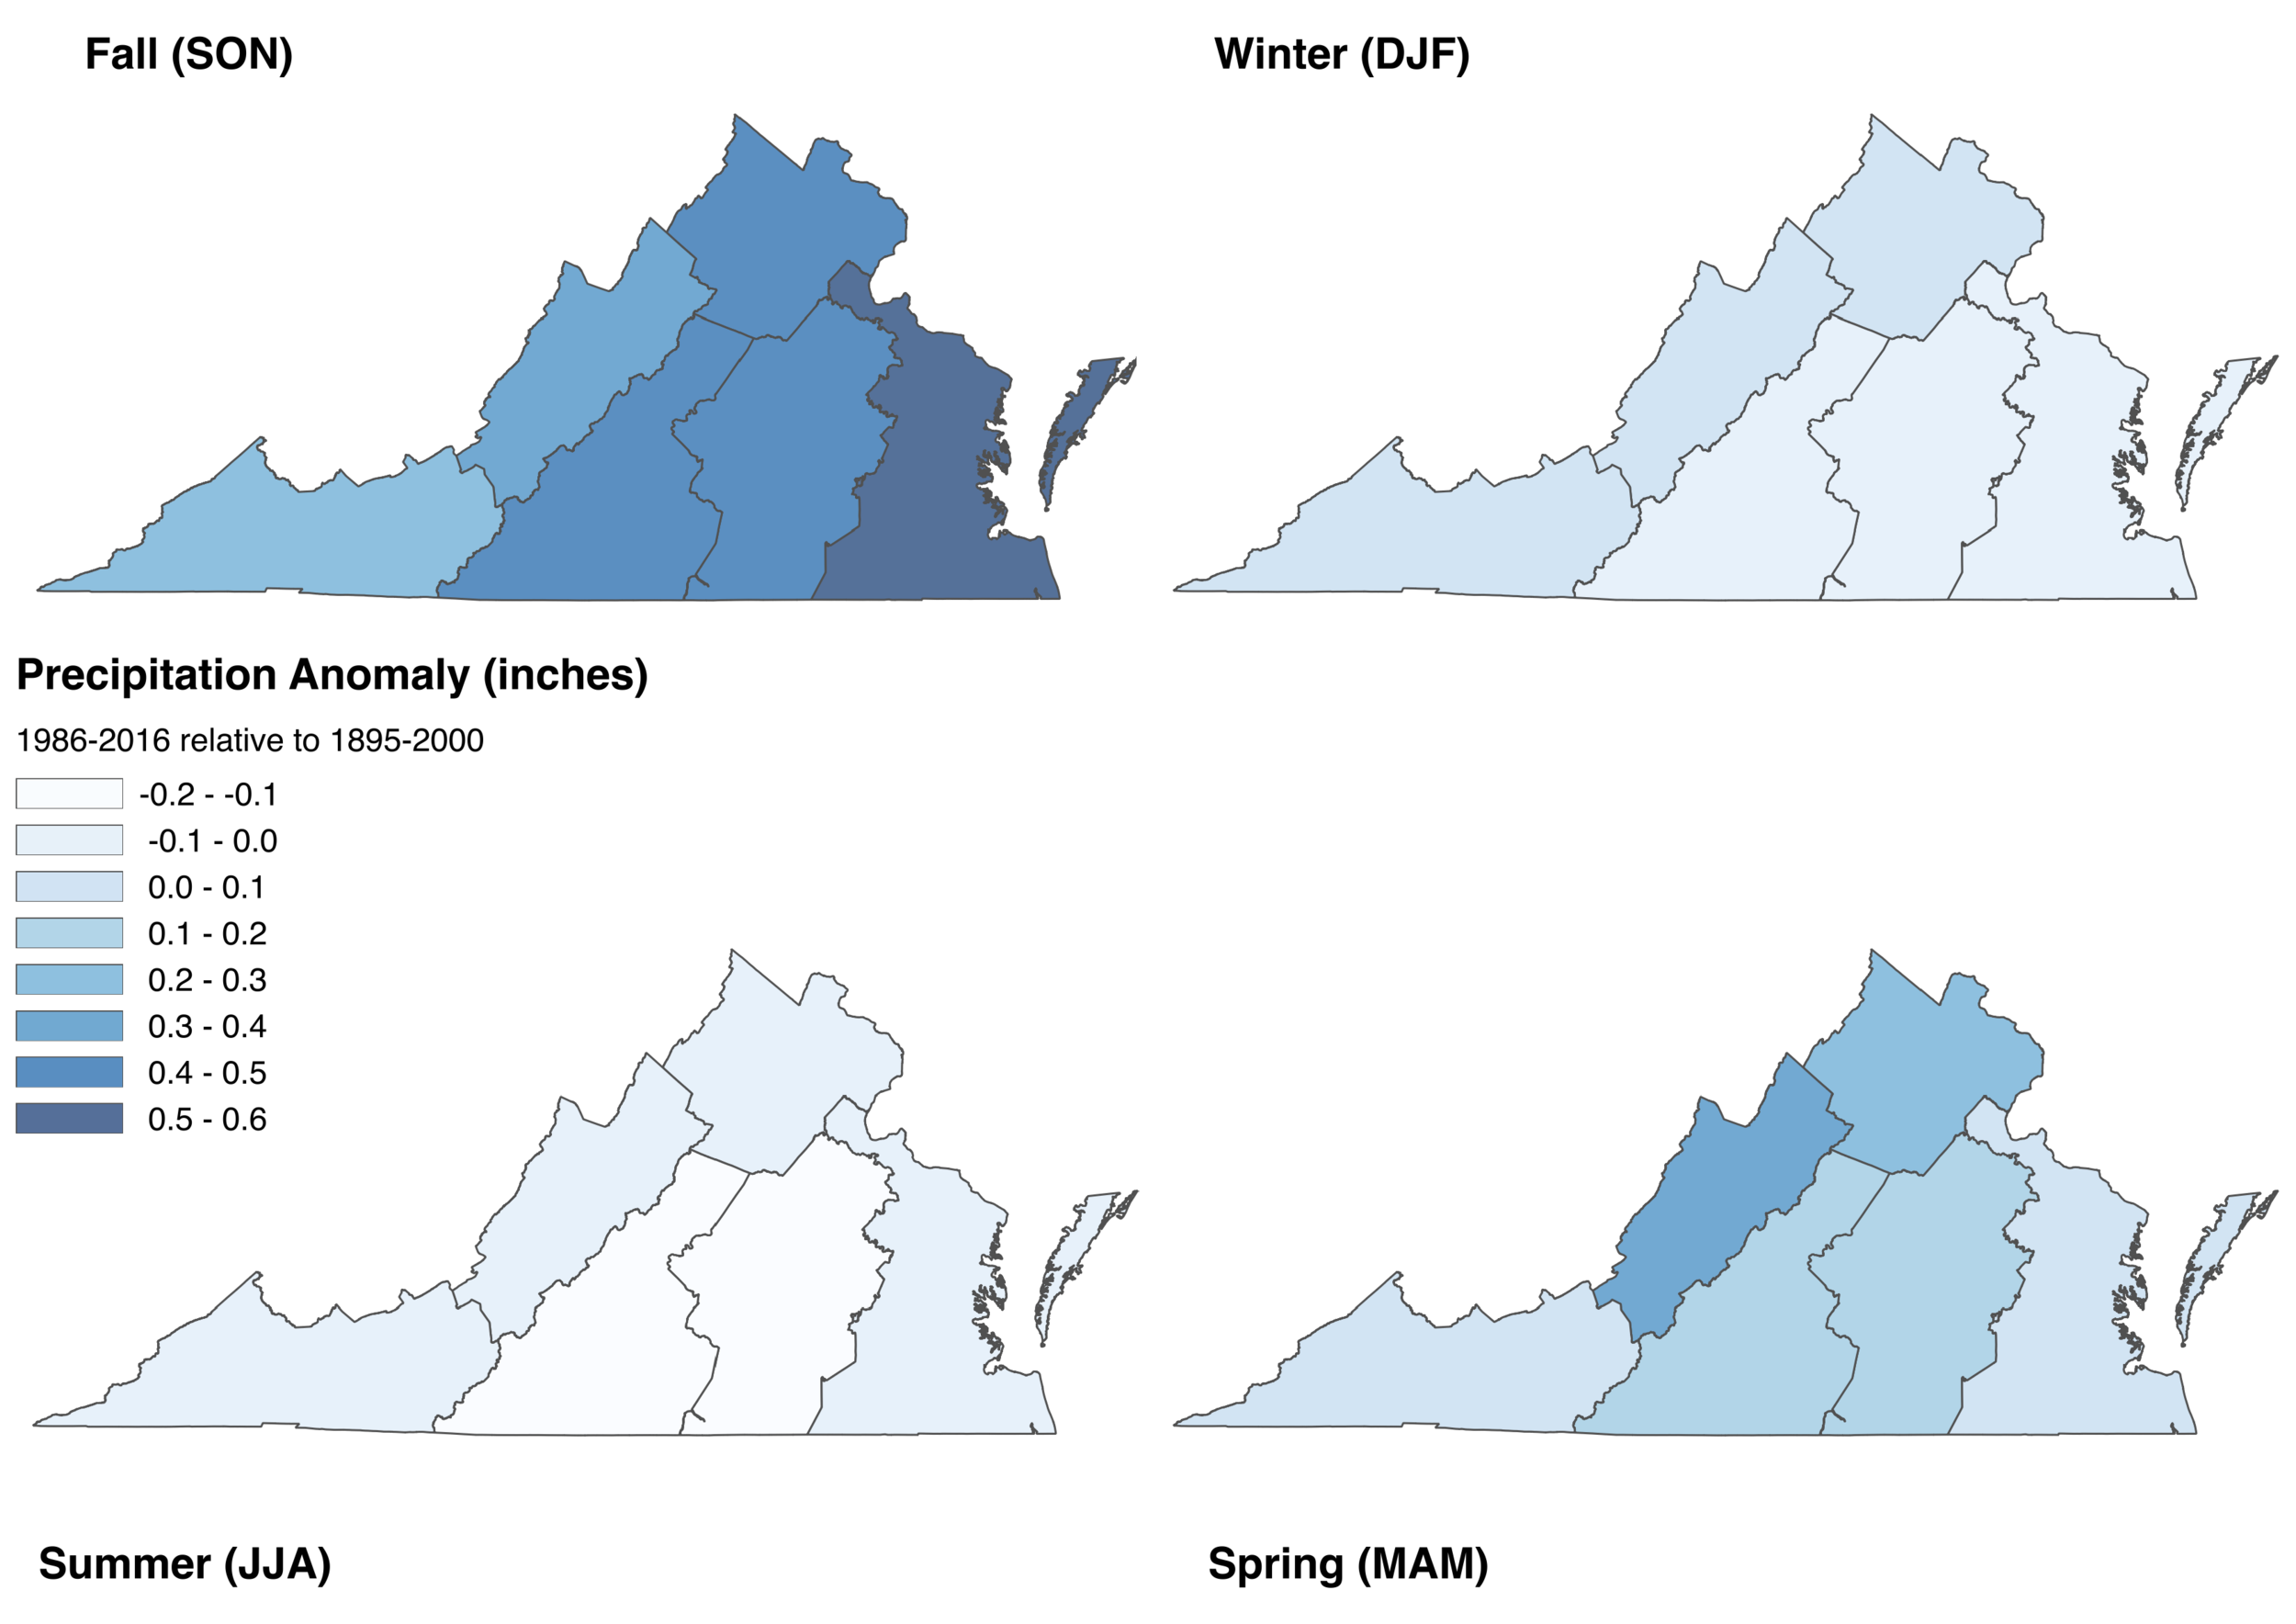
ASSESSING Temperature and Precipitation TRENDS Across Virginia’s Climate Divisions (LINK TO PAPER)
Hoffman, J.S., M.J. Allen, and C.F. Labosier, Detecting Change: Observations of Temperature and Precipitation Across Virginia’s Climate Divisions, Virginia Journal of Science 2019, 70(1); doi: 10.25778/eq3r-pv57
ASSESSING EXTREME URBAN HEAT USING COMMUNITY SCIENCE (LINK TO PAPER)
Shandas, Vivek, Voelkel, Jackson, Williams, Joseph, and Hoffman, J.S., Integrating Satellite and Ground Measurements for Predicting Locations of Extreme Urban Heat, Climate 2019, 7(1), 5; https://doi.org/10.3390/cli7010005
See media coverage on this project from the Richmond-Times Dispatch, WRIC ABC8 News

Figure 2. Washington, D.C. (A) aerial imagery with major waterbodies masked; (B) morning UHI; (C) afternoon UHI; (D) evening UHI. (Shandas et al., 2019).
Last interglacial sea-surface temperatures
Hoffman, Jeremy S., Clark, P.U., Parnell, A.C., and He, F. (2017), Regional and global sea-surface temperatures during the last interglaciation (Science 355, 6322, pp. 276-279 DOI: 10.1126/science.aai8464). Reprint available HERE.
Listen to the AAAS Science Minute podcast from Bob Gershon featuring this work here.
See media coverage from The Guardian (UK), The Independent (UK), Los Angeles Times, Reuters, Phys.org, Science Daily
Fig. 1 from Hoffman et al. (2017): (A) Site locations and types of proxy SST estimates included in this study. Symbols correspond to microfossil transfer functions (red triangles), Mg/Ca of planktonic foraminifera (green squares), and UK′37 (blue circles). (B) Histogram relating the number of LIG proxy records to 15° latitude bins. (C) Contour plot of annual mean latitudinal insolation anomalies relative to present. (D) Ice-core records of atmospheric CO2 concentrations on Antarctic Ice Core Chronology 2012 (AICC2012) timescale, with one standard deviation on measurement. Symbols indicate records from EPICA Dome C (EDC) ice core (green diamonds) (30), Talos Dome ice core (red circles) (31), and EPICA Dronning Maud Land (EDML) ice core (blue squares) (31). (E) The global LIG 5° Å~ 5° gridded area–weighted mean annual SST stack relative to the HadISST1.1 1870–1889 mean (black line) and the HadISST1.1 1995–2014 mean (green line). (F) Extratropical (>23.5°N-S) mean annual SST stacks relative to the HadISST1.1 1870–1889 data. Dark blue, NH extratropics; light blue, SH extratropics. (G) The tropical (23.5°N-S) mean annual SST stack relative to the HadISST1.1 1870–1889 data. (H) The North Atlantic (NATL) and South Atlantic (SATL) extratropical mean annual SST stacks (sites >23.5°N-S within the Atlantic basin) relative to the HadISST1.1 1870–1889 data. The proxy-based SST stacks and their uncertainty are the 5°x5° gridded, area-weighted mean and 2-sigma uncertainties of 1000 realizations used to construct the stacks.
What was the last interglacial? The last interglacial was the last time Earth's climate was generally comparable to our preindustrial climate (around 1750 CE): CO2 was about 280 ppm and there were no large ice sheets covering North America. The last interglacial lasted from about 129,000 years ago, when the Earth came out of the second-to-last ice age (called the penultimate glacial maximum or Marine Isotope Stage 6), until about 116,000 years ago, when the Earth began to descend into the most recent ice age (culminating in what is called the last glacial maximum).
Why is the last interglacial important to me? Many lines of evidence point to global sea level being at least ~20 feet higher than present during the last interglacial (Dutton et al., 2015), but global mean temperatures appear to be about the same as today (McKay et al., 2011). This relationship suggests that Earth's climate experienced a series self-amplifying feedbacks to generate a higher global mean sea level. Can these feedbacks contribute to higher sea levels than we've predicted for future climate change? Tens of millions of people live within ~20 feet of sea level today, so figuring this out is an important contribution to our knowledge of past and future climate changes.
So what did I do? Using a global database of climate proxies (or natural thermometers left behind by the Earth for us to figure out), I reevaluated global and regional patterns of sea surface temperature during the last interglacial. According to my (yet to be published) results, the global ocean during the last interglacial reached temperatures about 1°C warmer than the preindustrial ocean. This result is significant because human-caused climate change has already warmed the ocean about 0.85°C since 1880 (IPCC, 2013). Basically, we're approaching ocean temperatures not seen by Earth for almost 130,000 years! If the ocean played a role in generating the last interglacial sea-level high stand as is hypothesized by some scientists (see the Dutton et al. paper cited above), we might be committing ourselves to around ~20 feet of sea-level rise in the next century. This risk should play a role in planning for adaptation strategies for coastal communities and cities.
north atlantic deep-ocean temperature change during Heinrich event 1
Hoffman, Jeremy S., *Brown, Z.E.I., Clark, P.U., Mix, A.C., Haley, B.A., *de Jesus, E., Andrews, J.T., and He, F. (in prep), Deglacial subsurface warming at intermediate depths of the North Atlantic and its relation to Heinrich event 1.
*denotes mentored undergraduate research assistants

A graphic from my dissertation showing that most of the sediment core records of mid-depth North Atlantic benthic oxygen isotope variability (blue lines) can be explained from predicting oxygen isotopes values from temperature and salinity variability at the locations of the cores in the SynTraCE-21k deglacial experiment alone - a surprising finding that suggests the mid-depth North Atlantic warmed throughout the deglaciation and may have played a role in initiating Heinrich event 1.
What are Heinrich events? Few discoveries have galvanized the paleoclimate research community more so than Heinrich events. Heinrich (1988) related rapidly deposited, quasi-periodic or repeated layers of coarse sands found in ocean sediment cores from the North Atlantic ocean to iceberg discharge events from the major ice sheets during the last ice age. Broecker et al. (1992) coined the term "Heinrich event," and interpreted the layers as being created by "armadas of icebergs" originating from the Laurentide Ice Sheet, a now extinct mountain of ice that sat on top of North America and extended as far south as Des Moines, IA, during the last ice age. Heinrich events thus represent a striking example of a spectacular Earth process where ice sheets that connect to the ocean rapidly disintegrate and produce icebergs at an almost unbelievable scale. What remains to be determined about Heinrich events, however, is exactly how and why they occur.
Why are Heinrich events important to me? Figuring out the cause of Heinrich events can play a role in how we predict the rates of future sea-level rise, which will redefine the Earth's coastlines. One leading hypothesis for the origin of Heinrich events involves how ocean temperatures interact with and change the stability of the ice itself - and has an analogy with the present-day West Antarctic Ice Sheet. When glaciers flow into the ocean, part of them stays frozen to the seafloor, and the rest extends out over the surface of the ocean like a giant floating ice tongue. These are called ice shelves. If ocean temperatures get warm enough at the place where the ice is still frozen to the seafloor, it sets off a chain reaction that causes the ice shelf to break up catastrophically and any ice behind it to surge into the ocean. Some modern-day ice shelf breakup events in West Antarctica (for example, see the Larsen B ice shelf collapse) can be partially attributed to this process. If Heinrich events are attributable to rising ocean temperatures and their destabilizing effect on ice shelves, how will future warming of the ocean affect similar ice shelves in West Antarctica?
So what did I do? With the help of two undergraduate research assistants, I explored how a climate proxy of ocean temperature changed over time in two sediment cores from nearby the Hudson Strait outlet, right in the pathway that icebergs would have taken during a Heinrich event. Climate models also predict that these ocean sediment core locations would capture any ocean temperature warming that would affect the frozen base of the ice shelf that formed prior to Heinrich events. Preliminary results suggest that indeed, ocean temperatures increased prior to Heinrich events. These results suggest that continued ocean warming around the base of West Antarctic ice shelves could lead to more catastrophic disintegration events. The scientific community should continue efforts to monitor the ocean temperatures around these floating ice shelves in order to help refine predictions of future sea-level rise.
Abrupt climate change during the holocene
Hoffman, Jeremy S., Carlson, A.E., Winsor, K.,Klinkhammer, G.P., LeGrande, A.N., Andrews, J.T., Strasser, J.C. (2012), Linking the 8.2 ka event with its freshwater forcing in the Labrador Sea, Geophysical Research Letters 39, L18703, doi:10.1029/2012GL053047. REPRINT HERE

Hoffman et al., 2012 - Figure 2. This shows the arrival of 8.2 ka meltwater from the collapse of the ice dam over Hudson Strait and subsequent cooling (panel c) and freshening (panel e) of the surface waters in the Labrador Sea.
What was the 8.2 ka event? The 8.2 ka event (8.2 ka = 8,200 years ago) is the most significant large-scale climate change event recorded in Greenland ice cores during the otherwise relatively stable Holocene (the last ~11,000 years). The effects of the climate cooling during the 8.2 event were varied around the Northern hemisphere, including reductions in the Asian, African, and Indian monsoon cycles, loss of precipitation in northern Brazil, and advances of Norwegian glaciers (Rohling and Palike, 2005). These effects are all consistent with an abrupt shift to colder temperatures in the Northern hemisphere. The leading hypothesis for the cause of the 8.2 ka event suggest that the sudden drainage of glacial Lake Agassiz into the Labrador Sea and North Atlantic ocean caused a slowdown in the world's oceanic heat regulator, the Atlantic Meridional Overturning Circulation (AMOC). Some estimates (Li et al., 2012) suggest that this lake drainage contributed as much as ~2 meters (almost 7 feet) of sea-level rise. However, evidence from climate proxies was inconclusive about whether or not the cold & fresh waters of Lake Agassiz actually entered the relatively warmer & salty Labrador Sea - until now.
Why is the 8.2 ka event important to me? Rapid shifts in climate (on the order of years to decades), termed "abrupt climate change" (National Research Council, 2002) would greatly outpace society's ability to effectively adapt to them. Knowing how such Earth processes work can provide us with "worst-case scenario" estimates of future climate change. Is it likely that in the future a lake the size of Lake Agassiz will form and drain rapidly into the North Atlantic ocean, causing a similar cooling to the 8.2 ka event? Not very. Is there a chance that the cold & fresh water flowing off of the melting Greenland Ice Sheet could disrupt the AMOC in the future? Yes, but it depends on how quickly and how much our global temperature rises.
So what did I do? Using a climate proxy for surface ocean temperature in the shells of plankton (foraminifera), we show that the fingerprint of the Lake Agassiz drainage was obscured in previous studies by the competing effects of temperature and salinity on the isotopes (or, "flavors") of oxygen in these plankton shells. When plankton form their shells they lock in the chemistry of the ocean in which they are living, including the oxygen isotope ratio of the water. Cold water usually has more of the heavy oxygen isotope, oxygen-18, in it. Melting glacial ice has more of the light oxygen isotope, oxygen-16, in it. Thus, the cold & fresh water in the Lake Agassiz drainage would have been "stealth" chemistry for the plankton shells. By isolating one of the variables in that equation (temperature) we were able to show that surface ocean cooling of around 3°C masked the fingerprint of the glacial Lake Agassiz water in the ocean.

